Nashville, TN
sales software · nashville

Sales Forecasting Dashboards That Show the Deals Behind Every Number

Sales leaders in Nashville often build the forecast by asking each rep for a number on Monday. Nashline Software builds sales forecasting dashboards that calculate from live deals, stages and history, and open the deals behind every number.

3 min read · 3 sections · 3 answers

Fewer surprises

Risk seen early.

Faster meetings

Numbers already current.

Better coaching

Deal-level detail.

One version

Everyone sees the same forecast.

Leaders spend the meeting on deals at risk instead of rebuilding the spreadsheet.

01

Forecast from the pipeline

Each deal contributes by stage, age and your history of win rates. Leaders can compare the calculated forecast with rep commits.

  • Forecast by rep, team and region
  • Commit, best case and pipeline
  • Win rates by stage and source
  • Quota attainment
02

Risk you can open

Deals that slipped, went quiet or skipped a stage appear in a risk list with the owner and last activity.

// how sales dashboards & forecasting flows
  1. 1 Data collected
  2. 2 Definitions applied
  3. 3 Dashboard refreshed
  4. 4 Manager reviews
  5. 5 Actions assigned
03

Trends over time

See how the forecast moved week to week and which deals moved it, so surprises at quarter end become rare.

TodayWith sales dashboards & forecasting

✕Forecasts from rep emails

✓Forecasts from live deals

✕Risk found at quarter end

✓Risk list every week

✕Region sheets merged by hand

✓One dashboard for every region

The system handles

  • Refreshing dashboards
  • Tracking stage changes
  • Sending weekly summaries

Your people decide

  • Forecast calls
  • Coaching reps
  • Setting targets
your first release

What a first sales dashboards & forecasting release includes

A focused starting point, shaped with your team in Discovery and adjusted to how your Nashville team works. Then we build on it.

  1. Discover
  2. Design
  3. Build
  4. Launch
  5. Optimize
Plan your first release →
release planSales Dashboards & Forecasting · v1.0Ready to scope
  • Forecast definitions01
  • Leadership dashboard02
  • Risk and slippage lists03
  • CRM connection04
  • Weekly summary email05
  • Handover runbook and owner register06
Then: connect more tools, add automation and AI as your team is ready.
in practice

What sales dashboards & forecasting looks like day to day

Illustrative scenarios, not client stories.

A software reseller in the Gulch

Picture a Monday forecast built from rep emails. The dashboard is already current, and the meeting starts with the risk list.

Build something like this →Every system is shaped around your own process.
faq

Sales Dashboards & Forecasting: questions we hear

Still unsure? Ask us directly.

Where does the data come from?

From your CRM or the one we build, plus billing where it helps. Each source is documented.

Do we have to replace the software we use now?

Usually not. We connect the tools you keep where their APIs or exports allow, and build only what is missing.

Who owns the software?

You do. The code, the data and the documentation are yours after launch.

often built together

Sales Dashboards & Forecasting works best connected

Most teams start with one system and connect the next when they are ready. These are the services most often built alongside sales dashboards & forecasting, on the same record.

All services →
built by our team

See the pattern in a real system

A sales platform covering recruiting, training, the rep workspace and contracts, where signed and paid triggers delivery and commissions.

All highlighted work →
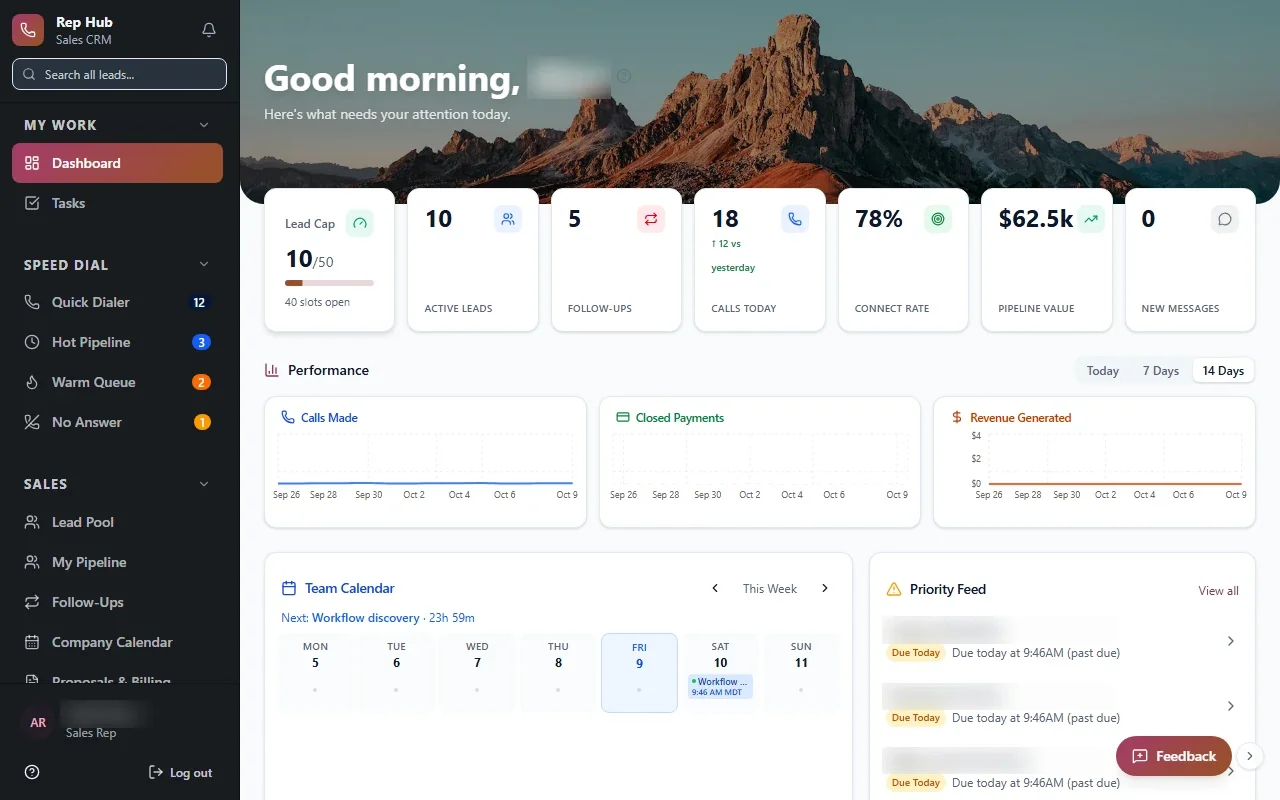
Rep HubRep Hub sales dashboard with lead pipeline, team performance, calendar and tasks Built · Sales organizationRep HubFrom joining the sales team to delivering the sale, in one connected platform.View the project →

Start with the problem. We'll build the possibility.

Tell us what slows your team down. We'll map it with you and suggest a useful first release, whether you're in Nashville or anywhere in Middle Tennessee.